
MX™ Connect Dashboard
The Dashboard in MXC provides visual analytics for monitoring portfolio performance. It displays real-time data related to account activity, product usage, and merchant distribution.
Introduction
The Dashboard in MXC provides visual analytics for monitoring portfolio performance. It displays real-time data related to account activity, product usage, and merchant distribution. The Dashboard is designed to give users a quick, high-level view of:
- How many accounts are active or closed
- Which products are being used
- Where merchants are located
- How the portfolio is trending over time
In this guide, you’ll find:
- When underwriting is triggered in MXC
- How automated and manual underwriting works
- The main types of underwriting checks
- Possible outcomes of underwriting
Key Definitions
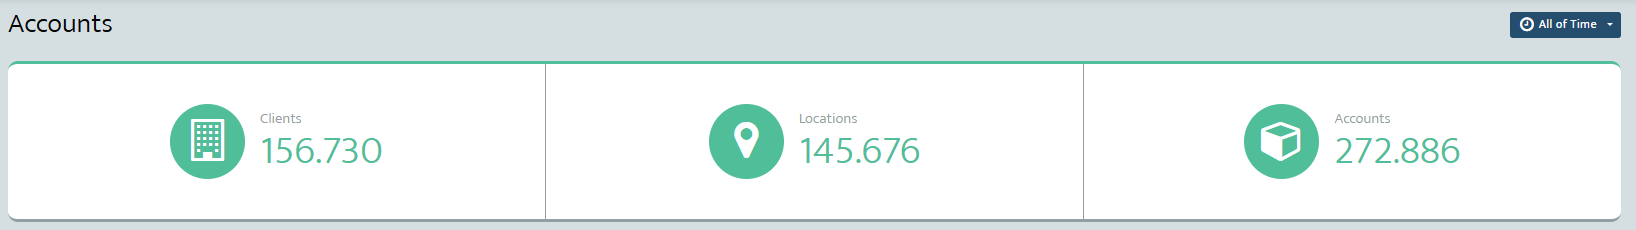
Within the Dashboard, account data is organized using the following terms:
- Clients – A merchant identification number assigned to a portfolio
- Locations – A DBA or physical business location
- Accounts – A product or service assigned to a merchant
Adding a Custom Dashboard
Users can create multiple dashboards to focus on specific data sets and metrics.
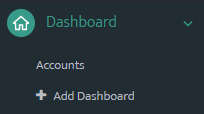
Add a Dashboard
- Navigate to the Dashboard section.
- Select Add Dashboard.
- Choose Add to open the widget library.
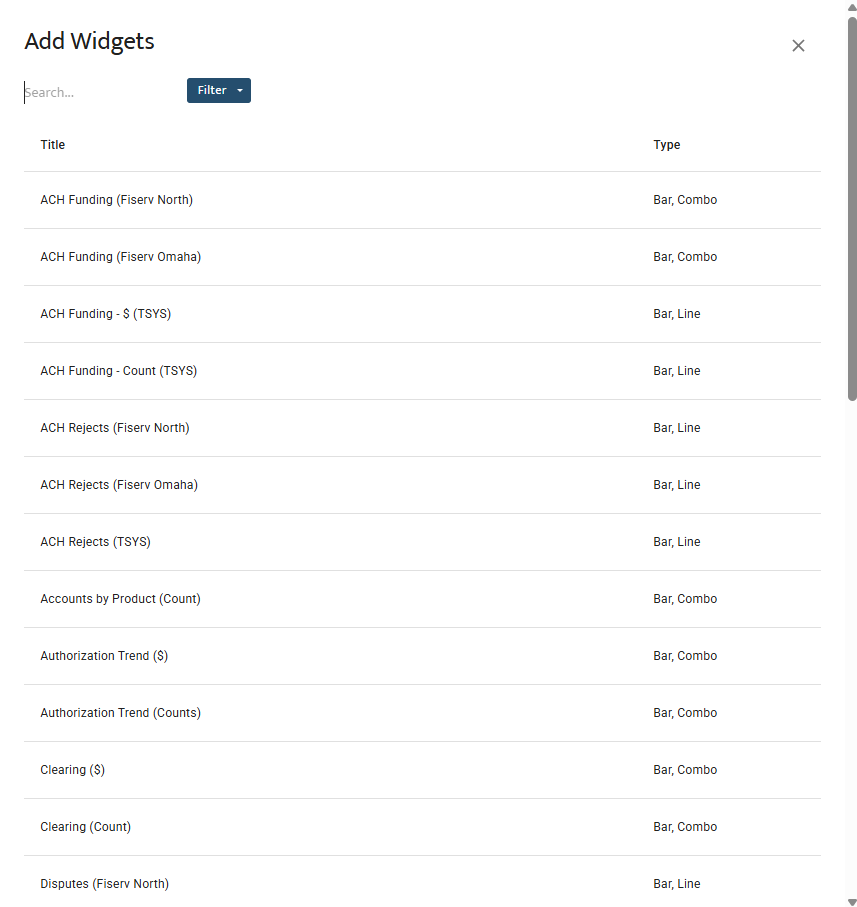
Add Widgets
Select the (+) Add button to view available widgets. You can add, rearrange, and resize widgets to match your workflow.
Save Dashboard
Select the Save icon in the top-right corner of the page.

You can choose one of the following save options for the new dashboard:
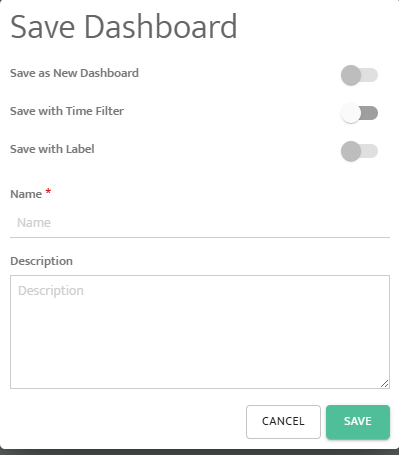
Select Save to finish.
Account Trend Widget
The Account Trend widget displays how accounts change over time.
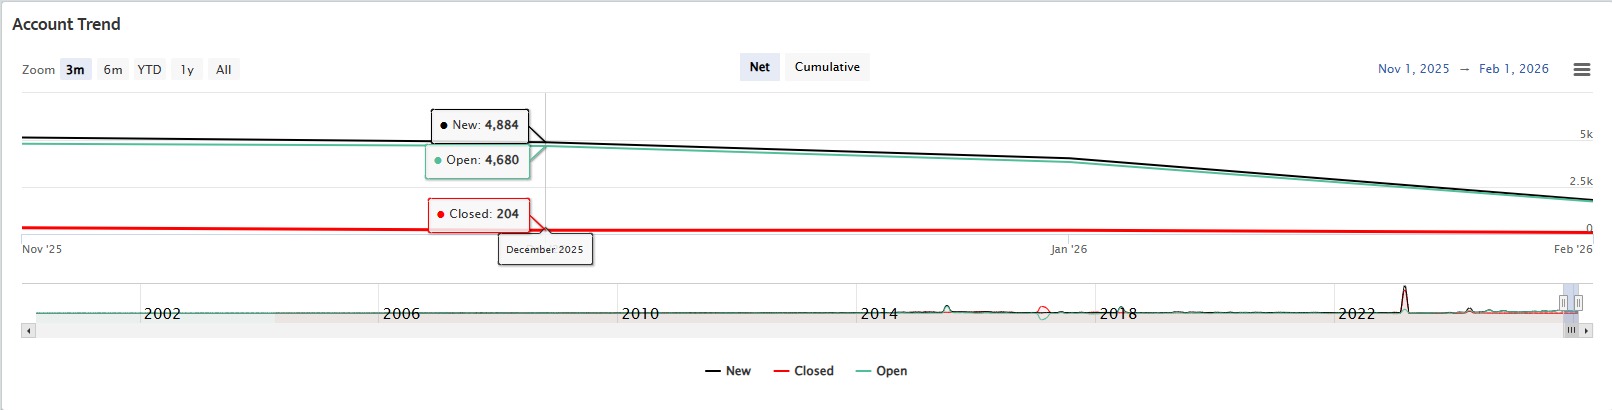
It shows:
- New accounts
- Closed accounts
- Open accounts
How to Use
- Select a preset time frame (for example, YTD) in the top-left corner, or
- Choose a custom date range using the From and To fields
Additional Features
- Use the menu icon to download, save, or print the data
- Click New, Closed, or Open to show or hide each line on the chart
Cumulative View
Selecting Cumulative displays total account counts over the selected time period (for example, total accounts from 2020 to 2024).
Top Statistics
The Top Statistics section provides a summary of key portfolio metrics using real-time data and sparklines.
Each statistic includes a time frame selector that controls which data is displayed.
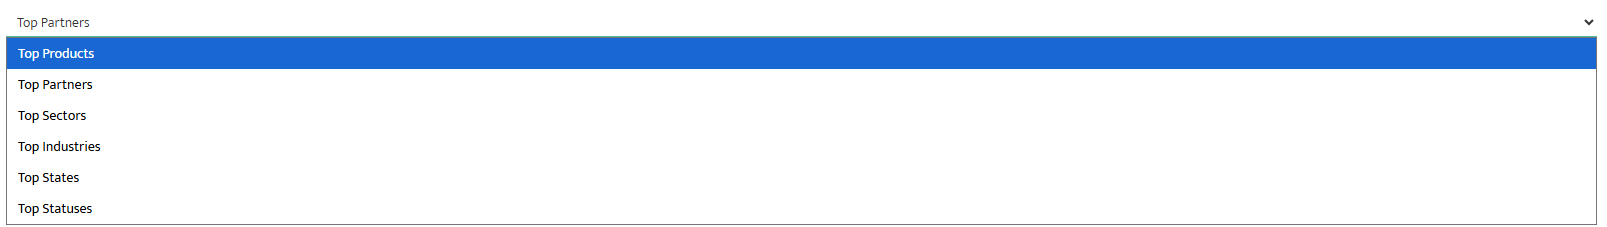
- Top Products – Products assigned to merchant accounts (e.g., TSYS, FD, MX™ Merchant)
- Top Partners – Partners with the highest number of merchant accounts
- Top Sectors – Business sectors such as retail or restaurant
- Top Industries – Industries based on SIC/MCC codes
- Top States – Merchant distribution by state
- Top Statuses – Account statuses such as Open, Closed, or Pending
Each tile provides a quick snapshot of portfolio performance and distribution.
Updated 30 days ago